Multiple Choice
The figure shows a normal N(400,23) distribution.Find the x value for the shaded area. 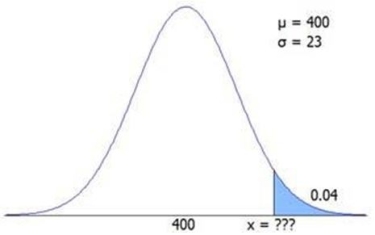
A) 412.9
B) 426.7
C) 436.2
D) 440.3
Correct Answer:

Verified
Correct Answer:
Verified
Related Questions
Q34: Which probability model is most appropriate to
Q62: For Gardyloo Manufacturing,the true proportion of accounts
Q63: The area under the normal curve between
Q64: In Melanie's Styling Salon,the time to complete
Q64: The Excel function =40*RAND() would generate random
Q65: A software developer makes 175 phone calls
Q68: If arrivals occur at a mean rate
Q69: The standard deviation of a normal random
Q70: A large number of applicants for admission
Q76: The area under an exponential curve can