Multiple Choice
The mean of a population is 50 and the median is 40.Which histogram is most likely for samples from this population? 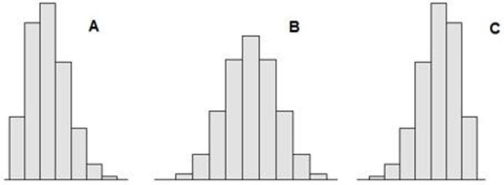
A) Sample A.
B) Sample B.
C) Sample C.
Correct Answer:

Verified
Correct Answer:
Verified
Related Questions
Q12: A positive kurtosis coefficient in Excel indicates
Q20: If there are 20 data values, the
Q48: If Excel's sample kurtosis coefficient is negative,
Q71: A data set with two values that
Q112: Which is not true of the Empirical
Q114: When a sample has an odd number
Q115: The 25th percentile for waiting time in
Q118: The heights of male students in a
Q119: Below are the ages of 21 CEOs.Find
Q120: As a measure of variability,compared to the