Essay
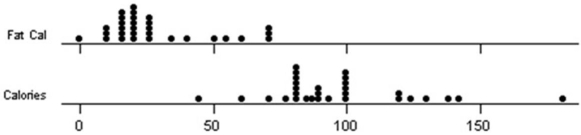
A team of introductory statistics students went to a grocery store and recorded the total calories and fat calories for various kinds of soup.They produced a table of statistics and two dot plots.Write a succinct summary of the center,variability,and shape for each data set.Note: TrimMean is the 5 percent trimmed mean (removing the smallest 5 percent and the largest 5 percent of the values,rounded to the nearest integer).

Correct Answer:

Verified
Both are right-skewed (mean > median)tho...View Answer
Unlock this answer now
Get Access to more Verified Answers free of charge
Correct Answer:
Verified
View Answer
Unlock this answer now
Get Access to more Verified Answers free of charge
Q21: Six graduates from Fulsome University's Master's of
Q23: Which is the Excel formula for the
Q24: The 25th percentile for waiting time in
Q27: A survey of 10 randomly chosen drivers
Q28: Which is not a characteristic of the
Q29: Twelve students were asked how many credit
Q30: John scored 35 on Prof.Johnson's exam (Q1
Q34: Eleven students were asked how many siblings
Q72: Outliers are indicated using fences on a<br>A)box
Q106: The position of the median is:<br>A)n/2 in