True/False
Because most data values are on the left,we would say that this dot plot (burglary rates per 100,000 persons in 350 U.S.cities)shows a distribution that is skewed to the left (negatively skewed). 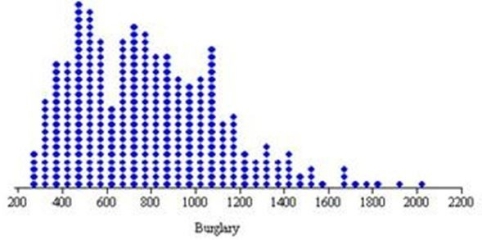
Correct Answer:

Verified
Correct Answer:
Verified
Related Questions
Q12: Excel's 3D pie charts are usually clearer
Q21: Which is not considered a deceptive graphical
Q29: Which is a reason for using a
Q39: Briefly list strengths and weaknesses of this
Q40: Below is a frequency distribution of earnings
Q41: A population is of size 5,500 observations.When
Q75: Except for the Y-axis scaling, a histogram
Q83: A column chart would be least suitable
Q97: Pivot tables:<br>A)are similar in purpose to simple
Q105: Excel's pyramid charts make it easier to