Multiple Choice
Figure 5-9 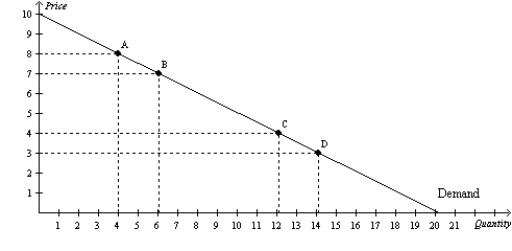
-Refer to Figure 5-9. Using the midpoint method, the price elasticity of demand between point A and point B is
A) 0.33.
B) 0.5.
C) 2.0.
D) 3.0.
Correct Answer:

Verified
Correct Answer:
Verified
Related Questions
Q22: Figure 5-11 <img src="https://d2lvgg3v3hfg70.cloudfront.net/TB2186/.jpg" alt="Figure 5-11
Q46: On a certain supply curve,one point is
Q82: Suppose that when the price rises by
Q107: Drug interdiction, which reduces the supply of
Q164: Which of the following statements is correct?<br>A)The
Q174: Suppose the price of gas increases by
Q199: If the price elasticity of demand for
Q296: If the price of milk rises,when is
Q356: Figure 5-15 <img src="https://d2lvgg3v3hfg70.cloudfront.net/TB2179/.jpg" alt="Figure 5-15
Q358: A manufacturer produces 400 units when the