Multiple Choice
Figure 5-12 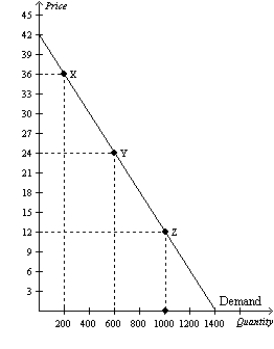
-Refer to Figure 5-12. Using the midpoint method, the price elasticity of demand between point Y and point Z is
A) 0.5.
B) 0.75.
C) 1.0.
D) 1.3.
Correct Answer:

Verified
Correct Answer:
Verified
Q48: Using the midpoint method,the price elasticity of
Q59: Goods with close substitutes tend to have
Q96: Figure 5-4 <img src="https://d2lvgg3v3hfg70.cloudfront.net/TB2297/.jpg" alt="Figure 5-4
Q109: If demand is price inelastic,then when price
Q119: Suppose you manage a baseball stadium. To
Q216: Figure 5-11 <img src="https://d2lvgg3v3hfg70.cloudfront.net/TB2297/.jpg" alt="Figure 5-11
Q265: Suppose that when the price of good
Q301: Table 5-13<br>Consider the following demand schedule.<br> <img
Q493: Figure 5-15 <img src="https://d2lvgg3v3hfg70.cloudfront.net/TB2179/.jpg" alt="Figure 5-15
Q611: How does the concept of elasticity allow