Multiple Choice
Figure 8-2
The vertical distance between points A and B represents a tax in the market. 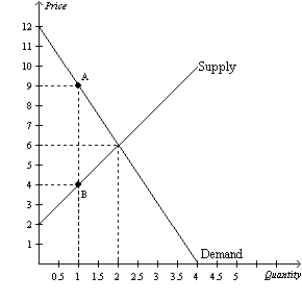
-Refer to Figure 8-2. The loss of consumer surplus for those buyers of the good who continue to buy it after the tax is imposed is
A) $0.
B) $1.50.
C) $3.
D) $4.50.
Correct Answer:

Verified
Correct Answer:
Verified
Q5: Labor taxes may distort labor markets greatly
Q18: Figure 8-2<br>The vertical distance between points A
Q25: The more inelastic are demand and supply,
Q46: When the price of a good is
Q61: Figure 8-10 <img src="https://d2lvgg3v3hfg70.cloudfront.net/TB2297/.jpg" alt="Figure 8-10
Q63: Figure 8-9<br>The vertical distance between points A
Q120: Figure 8-6<br>The vertical distance between points A
Q161: If a tax shifts the supply curve
Q179: Figure 8-1 <img src="https://d2lvgg3v3hfg70.cloudfront.net/TB2297/.jpg" alt="Figure 8-1
Q197: Figure 8-6<br>The vertical distance between points A