Multiple Choice
Figure 8-5
Suppose that the government imposes a tax of P3 - P1. 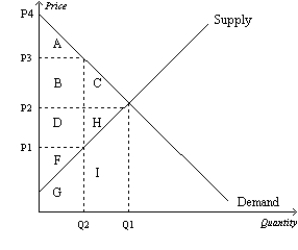
-Refer to Figure 8-5.The loss in total welfare that results from the tax is represented by area
A) A+B+D+F.
B) A+B+C.
C) D+H+F.
D) C+H.
Correct Answer:

Verified
Correct Answer:
Verified
Q65: Figure 8-7<br>The vertical distance between points A
Q67: Figure 8-2<br>The vertical distance between points A
Q68: Figure 8-9<br>The vertical distance between points A
Q69: Figure 8-8<br>Suppose the government imposes a $10
Q71: When a tax on a good is
Q72: Figure 8-9<br>The vertical distance between points A
Q73: Figure 8-6<br>The vertical distance between points A
Q74: Figure 8-11 <img src="https://d2lvgg3v3hfg70.cloudfront.net/TB2297/.jpg" alt="Figure 8-11
Q75: Figure 8-3<br>The vertical distance between points A
Q197: Figure 8-1 <img src="https://d2lvgg3v3hfg70.cloudfront.net/TB7555/.jpg" alt="Figure 8-1