Multiple Choice
Figure 8-11 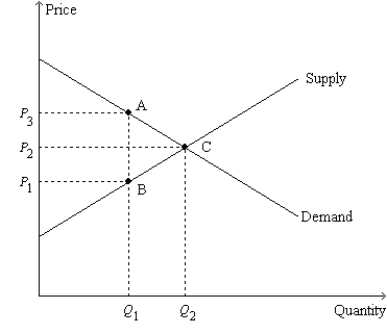
-Refer to Figure 8-11.The size of the tax is represented by the
A) length of the line segment connecting points A and B.
B) length of the line segment connecting points A and C.
C) length of the line segment connecting points B and C.
D) area of the triangle bounded by the points A,B,and C.
Correct Answer:

Verified
Correct Answer:
Verified
Q94: Figure 8-1 <img src="https://d2lvgg3v3hfg70.cloudfront.net/TB2297/.jpg" alt="Figure 8-1
Q95: Figure 8-3<br>The vertical distance between points A
Q96: Which of the following quantities decrease in
Q97: Figure 8-2<br>The vertical distance between points A
Q98: When a tax is levied on buyers
Q100: The loss in total surplus resulting from
Q101: Figure 8-9<br>The vertical distance between points A
Q102: Figure 8-1 <img src="https://d2lvgg3v3hfg70.cloudfront.net/TB2297/.jpg" alt="Figure 8-1
Q103: Suppose a tax of $4 per unit
Q104: Figure 8-11 <img src="https://d2lvgg3v3hfg70.cloudfront.net/TB2297/.jpg" alt="Figure 8-11