Multiple Choice
Figure 8-11 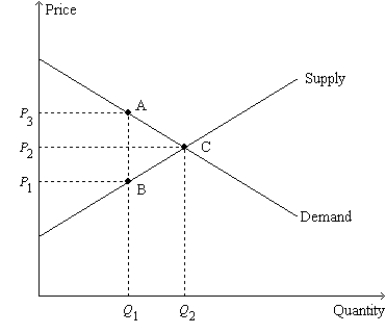
-Refer to Figure 8-11. The price labeled as P2 on the vertical axis represents the
A) difference between the price paid by buyers after the tax is imposed and the price paid by buyers before the tax is imposed.
B) difference between the price received by sellers before the tax is imposed and the price received by sellers after the tax is imposed.
C) price of the good before the tax is imposed.
D) price of the good after the tax is imposed.
Correct Answer:

Verified
Correct Answer:
Verified
Q19: Taxes drive a wedge into the market
Q25: Consider a good to which a per-unit
Q31: When a good is taxed,the burden of
Q50: When a tax is imposed on a
Q54: Assume that for good X the supply
Q63: Figure 8-9<br>The vertical distance between points A
Q90: When a tax is imposed on buyers,
Q184: Figure 8-10 <img src="https://d2lvgg3v3hfg70.cloudfront.net/TB2297/.jpg" alt="Figure 8-10
Q244: Total surplus with a tax is equal
Q361: Scenario 8-3<br>Suppose the market demand and market