Multiple Choice
Figure 8-22 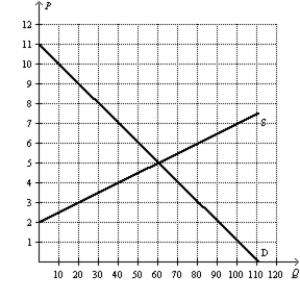
-Refer to Figure 8-22.Suppose the government changed the per-unit tax on this good from $3.00 to $1.50.Compared to the original tax rate,this lower tax rate would
A) increase tax revenue and increase the deadweight loss from the tax.
B) increase tax revenue and decrease the deadweight loss from the tax.
C) decrease tax revenue and increase the deadweight loss from the tax.
D) decrease tax revenue and decrease the deadweight loss from the tax.
Correct Answer:

Verified
Correct Answer:
Verified
Q1: An increase in the size of a
Q4: In the early 1980s,which of the following
Q5: Assume that for good X the supply
Q8: Figure 8-22 <img src="https://d2lvgg3v3hfg70.cloudfront.net/TB2297/.jpg" alt="Figure 8-22
Q8: Figure 8-22 <img src="https://d2lvgg3v3hfg70.cloudfront.net/TB2297/.jpg" alt="Figure 8-22
Q9: Figure 8-24.The figure represents the relationship between
Q10: Figure 8-21 <img src="https://d2lvgg3v3hfg70.cloudfront.net/TB2297/.jpg" alt="Figure 8-21
Q11: The Laffer curve illustrates that<br>A)deadweight loss rises
Q79: Suppose the government increases the size of
Q133: If the tax on a good is