Multiple Choice
Figure 8-23. The figure represents the relationship between the size of a tax and the tax revenue raised by that tax. 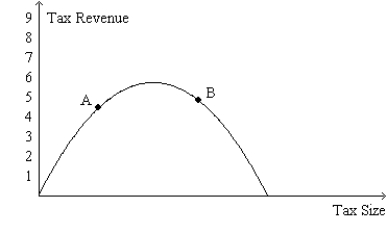
-Refer to Figure 8-23. If the economy is at point B on the curve, then an increase in the tax rate will
A) increase the deadweight loss of the tax and increase tax revenue.
B) increase the deadweight loss of the tax and decrease tax revenue.
C) decrease the deadweight loss of the tax and increase tax revenue.
D) decrease the deadweight loss of the tax and decrease tax revenue.
Correct Answer:

Verified
Correct Answer:
Verified
Q16: The demand for energy drinks is more
Q21: Suppose the government places a per-unit tax
Q21: The Social Security tax is a tax
Q54: Figure 8-18 <img src="https://d2lvgg3v3hfg70.cloudfront.net/TB2297/.jpg" alt="Figure 8-18
Q57: The deadweight loss from a tax of
Q98: When a tax is imposed on a
Q104: Figure 8-11 <img src="https://d2lvgg3v3hfg70.cloudfront.net/TB2297/.jpg" alt="Figure 8-11
Q127: Suppose Rebecca needs a dog sitter so
Q167: The more elastic are supply and demand
Q182: Figure 8-4<br>The vertical distance between points A