Multiple Choice
Figure 8-23. The figure represents the relationship between the size of a tax and the tax revenue raised by that tax. 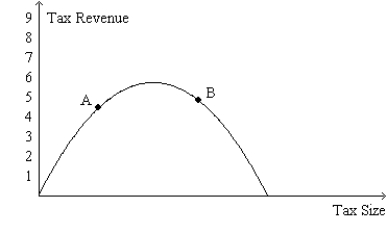
-Refer to Figure 8-23. If the economy is at point B on the curve, then a small decrease in the tax rate will
A) increase the deadweight loss of the tax and increase tax revenue.
B) increase the deadweight loss of the tax and decrease tax revenue.
C) decrease the deadweight loss of the tax and increase tax revenue.
D) decrease the deadweight loss of the tax and decrease tax revenue.
Correct Answer:

Verified
Correct Answer:
Verified
Q6: The deadweight loss from a $3 tax
Q12: Economists disagree on whether labor taxes cause
Q27: Scenario 8-2<br>Roland mows Karla's lawn for $25.Roland's
Q28: The result of the large tax cuts
Q42: Figure 8-6<br>The vertical distance between points A
Q47: Taxes cause deadweight losses because taxes<br>A)reduce the
Q49: Figure 8-25 <img src="https://d2lvgg3v3hfg70.cloudfront.net/TB2297/.jpg" alt="Figure 8-25
Q73: Suppose that the market for product X
Q136: Figure 8-1 <img src="https://d2lvgg3v3hfg70.cloudfront.net/TB2297/.jpg" alt="Figure 8-1
Q211: Figure 8-6<br>The vertical distance between points A