Multiple Choice
Figure 8-24.The figure represents the relationship between the size of a tax and the tax revenue raised by that tax. 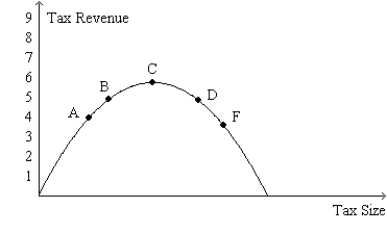
-Refer to Figure 8-24.Tax revenue would
A) decrease if the economy began at point B and then the tax rate was decreased.
B) increase if the economy began at point F and then the tax rate was decreased.
C) decrease if the economy began at point C and then the tax rate was increased.
D) All of the above are correct.
Correct Answer:

Verified
Correct Answer:
Verified
Q4: In the early 1980s,which of the following
Q5: Assume that for good X the supply
Q8: Figure 8-22 <img src="https://d2lvgg3v3hfg70.cloudfront.net/TB2297/.jpg" alt="Figure 8-22
Q8: Figure 8-22 <img src="https://d2lvgg3v3hfg70.cloudfront.net/TB2297/.jpg" alt="Figure 8-22
Q10: Figure 8-21 <img src="https://d2lvgg3v3hfg70.cloudfront.net/TB2297/.jpg" alt="Figure 8-21
Q11: The Laffer curve illustrates that<br>A)deadweight loss rises
Q12: Assume that for good X the supply
Q13: Ronald Reagan believed that reducing income tax
Q14: Which of the following statements is correct?<br>A)A
Q133: If the tax on a good is