Multiple Choice
Figure 8-24.The figure represents the relationship between the size of a tax and the tax revenue raised by that tax. 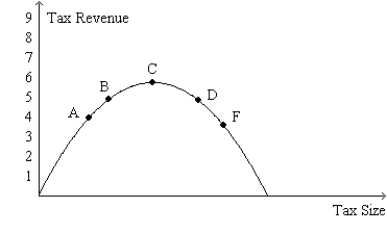
-Refer to Figure 8-24.For an economy that is currently at point D on the curve,a decrease in the tax rate would
A) decrease consumer surplus.
B) decrease producer surplus.
C) increase tax revenue.
D) increase the deadweight loss of the tax.
Correct Answer:

Verified
Correct Answer:
Verified
Q37: The Laffer curve relates<br>A)the tax rate to
Q38: Figure 8-19<br>The vertical distance between points A
Q39: Which of the following statements is true
Q40: Which of the following ideas is the
Q41: Figure 8-22 <img src="https://d2lvgg3v3hfg70.cloudfront.net/TB2297/.jpg" alt="Figure 8-22
Q43: Which of the following statements correctly describes
Q44: In which of the following cases is
Q45: Suppose a tax of $0.50 per unit
Q47: If the tax on a good is
Q63: In which of the following instances would