Multiple Choice
Exhibit 12-3
Regression analysis was applied between sales data (in $1,000s) and advertising data (in $100s) and the following information was obtained.
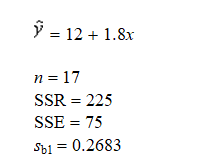
-Refer to Exhibit 12-3. The F statistic computed from the above data is
A) 3
B) 45
C) 48
D) Not enough information is given to answer this question.
Correct Answer:

Verified
Correct Answer:
Verified
Q18: Data points having high leverage are often<br>A)residuals<br>B)sum
Q26: In simple linear regression analysis, which of
Q47: A procedure used for finding the equation
Q74: In regression analysis, which of the
Q84: Shown below is a portion of an
Q85: The following data represent the number of
Q87: Shown below is a portion of a
Q90: In a simple regression analysis (where y
Q93: A data point (observation) that does not
Q101: In a regression analysis if SST =