Multiple Choice
Exhibit 12-3
Regression analysis was applied between sales data (in $1,000s) and advertising data (in $100s) and the following information was obtained.
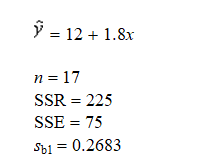
-Refer to Exhibit 12-3. The t statistic for testing the significance of the slope is
A) 1.80
B) 1.96
C) 6.709
D) 0.555
Correct Answer:

Verified
Correct Answer:
Verified
Q14: In regression analysis, the variable that is
Q42: The interval estimate of the mean value
Q55: A company has recorded data on the
Q58: Exhibit 12-4<br>The following information regarding a dependent
Q59: Given below are seven observations collected in
Q61: Exhibit 12-5<br>You are given the following information
Q61: A least squares regression line<br>A)may be used
Q64: A company has recorded data on the
Q67: Regression analysis is a statistical procedure for
Q125: If the coefficient of correlation is a