Multiple Choice
Exhibit 12-3
Regression analysis was applied between sales data (in $1,000s) and advertising data (in $100s) and the following information was obtained.
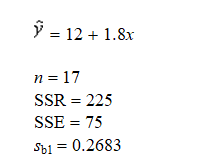
-Refer to Exhibit 12-3. Using 0.05, the critical t value for testing the significance of the slope is
A) 1.753
B) 2.131
C) 1.746
D) 2.120
Correct Answer:

Verified
Correct Answer:
Verified
Q21: In regression and correlation analysis, if SSE
Q28: Shown below is a portion of a
Q29: Exhibit 12-2<br>You are given the following information
Q32: Application of the least squares method results
Q35: Exhibit 12-5<br>You are given the following information
Q64: The proportion of the variation in the
Q75: As the goodness of fit for the
Q94: In a regression analysis if r<sup>2</sup> =
Q96: If two variables, x and y, have
Q109: Larger values of r<sup>2</sup> imply that the