menu-iconExamlexExamLexServices

Discover

Ask a Question
  1. All Topics
  2. Topic
    Statistics
  3. Study Set
    Essentials of Modern Business
  4. Exam
    Exam 2: Descriptive Statistics: Tabular and Graphical Presentations
  5. Question
    What Type of Graph Is Depicted Below
Solved

What Type of Graph Is Depicted Below

Question 53

Question 53

Short Answer

What type of graph is depicted below? What type of graph is depicted below?

Correct Answer:

verifed

Verified

Unlock this answer now
Get Access to more Verified Answers free of charge

Related Questions

Q22: The relative frequency of a class is

Q27: The minimum number of variables represented in

Q36: A tabular method that can be used

Q48: Forty shoppers were asked if they preferred

Q53: The percent frequency of a class is

Q55: Exhibit 2-1<br>The numbers of hours worked (per

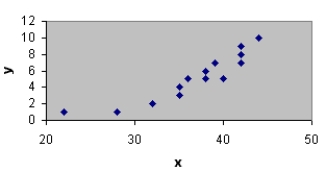
Q58: For the following observations, plot a scatter

Q60: A graphical method that can be used

Q69: In a cumulative relative frequency distribution, the

Q84: In a cumulative frequency distribution, the last

Examlex

ExamLex

About UsContact UsPerks CenterHomeschoolingTest Prep

Work With Us

Campus RepresentativeInfluencers

Links

FaqPricingChrome Extension

Download The App

Get App StoreGet Google Play

Policies

Privacy PolicyTerms of ServiceHonor CodeCommunity Guidelines

Scan To Download

qr-code

Copyright © (2025) ExamLex LLC.

Privacy PolicyTerms Of ServiceHonor CodeCommunity Guidelines