Multiple Choice
The following scatterplot depicts a correlation coefficient that would be close to 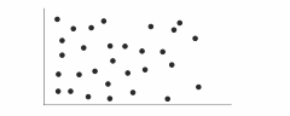
A) +1.0.
B) -1.0.
C) 0.00.
D) 0.50.
Correct Answer:

Verified
Correct Answer:
Verified
Related Questions
Q25: Which of the following sets of scores
Q31: Which of the following correlation coefficients expresses
Q35: The standard deviation is a measure of<br>A)
Q41: To calculate the numerical value of the
Q43: The average price for different brands of
Q50: In a group of five individuals,two report
Q75: Which of the following provides a rough
Q76: A lopsided set of scores that includes
Q80: Approximately what percentage of the cases represented
Q143: Which of the following is a measure