Multiple Choice
In the diagram below,the red line represents 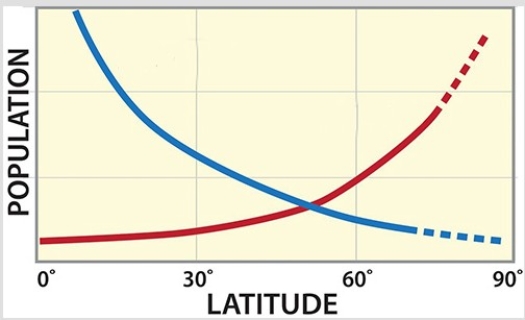
A) K-selected species.
B) omnivores.
C) herbivores.
D) r-selected species.
Correct Answer:

Verified
Correct Answer:
Verified
Related Questions
Q60: Species that reproduce quickly and have offspring
Q61: What would be the overall response of
Q62: The diagram below shows that <img src="https://d2lvgg3v3hfg70.cloudfront.net/TB5492/.jpg"
Q63: Which of the following parts of the
Q64: CAM plants<br>A)use energy sources at hydrothermal vents
Q66: How does the Volcano Arenal affect the
Q67: The major difference between richness and equitability
Q68: The Namibian coast is impacted most directly
Q69: Which of the following conditions act to
Q70: An open system is characterized by<br>A)inputs of