Multiple Choice
The diagram below represents a model that the U.S.Geological Survey (USGS) uses to categorize the extent of storm surge in the coastal zone.The red arrow in this figure points to 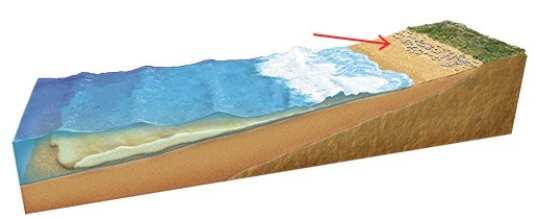
A) the maximum height of the swash zone.
B) the highest rate of discharge from the nearest stream.
C) the radius of motion of water molecules that are part of the waves of oscillation.
D) the height of high tide.
Correct Answer:

Verified
Correct Answer:
Verified
Q64: In the coastlines investigation,what coastline process is
Q65: With the Moon in this position,which area
Q66: The depth of wave base is the
Q67: What happens to the land surface when
Q68: Which way is the current moving along
Q70: In the coastlines investigation,what coastline process is
Q71: Three damaging hurricanes on the U.S.Atlantic and
Q72: Factors that affect the appearance of a
Q73: During a hurricane or other strong coastal
Q74: Climate influences the processes along coastal landscapes