Multiple Choice
Compared with curve 2 on this hydrograph,what is a possible explanation for curve 1? 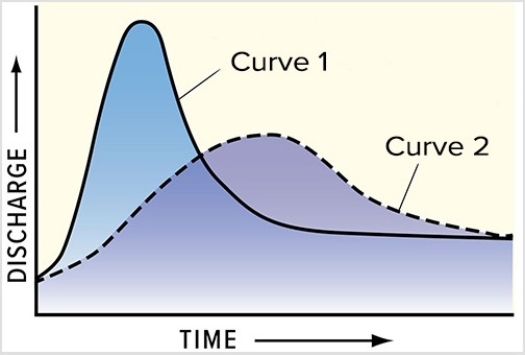
A) The basin for curve 1 has steeper slopes than the basin for curve 2.
B) The storm recorded by curve 1 was shorter and more intense than the storm represented by curve 2.
C) Curve 1 shows the same area as curve 2 but after urbanization.
D) All of these are possible.
Correct Answer:

Verified
Correct Answer:
Verified
Q84: What was the cause of flooding in
Q88: Which of the following features are generally
Q89: What type of stream is shown in
Q90: Feature A,formed where the Nile River encounters
Q91: Which of the features on this aerial
Q92: What is the pattern of discharge shown
Q94: Where do mountain streams get most of
Q96: Which of the following is the main
Q97: Which of the following typically decreases downstream
Q98: What does the associated graph indicate about