Multiple Choice
In the diagram below, the red line represents 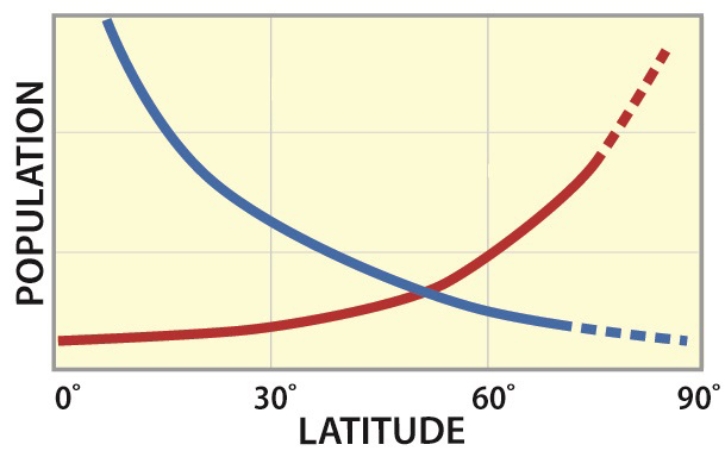
A) K-selected species.
B) omnivores.
C) herbivores.
D) r-selected species.
Correct Answer:

Verified
Correct Answer:
Verified
Related Questions
Q24: Guano is significant because<br>A)it is a major
Q29: In the diagram below, the importance of
Q30: Which of the following parts of the
Q31: The diagram below shows that <img src="https://d2lvgg3v3hfg70.cloudfront.net/TB5490/.jpg"
Q33: Storms can compound problems related to hypoxia
Q35: In the diagram below, the population growth
Q38: The diagram below shows that most of
Q39: In which of the following places on
Q82: The hypoxia problem in the Gulf of
Q88: Detritivores eat<br>A)almost solely plants.<br>B)decaying plants and/or animals