menu-iconExamlexExamLexServices

Discover

Ask a Question
  1. All Topics
  2. Topic
    Geology/Geography/Oceanography/Atmospheric Sciences
  3. Study Set
    Exploring Physical Geography Study Set 1
  4. Exam
    Exam 17: Ecosystems and Biogeochemical Cycles
  5. Question
    In the Diagram Below, the Red Arrows Represent
Solved

In the Diagram Below, the Red Arrows Represent

Question 67

Question 67

Multiple Choice

In the diagram below, the red arrows represent In the diagram below, the red arrows represent   A) fluxes that are increasing over time. B) fluxes that have little environmental impact. C) fluxes that are constant across time. D) human-influenced fluxes.
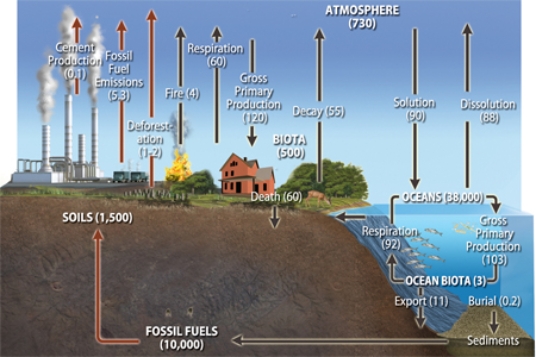

A) fluxes that are increasing over time.
B) fluxes that have little environmental impact.
C) fluxes that are constant across time.
D) human-influenced fluxes.

Correct Answer:

verifed

Verified

Unlock this answer now
Get Access to more Verified Answers free of charge

Related Questions

Q38: Biomagnification can directly cause<br>A)increases in the amount

Q62: A likely scenario for causing the population

Q63: Nitrates often used for gunpowders, explosives, and

Q64: The diagram below depicts the global <img

Q65: The diagram below depicts the <img src="https://d2lvgg3v3hfg70.cloudfront.net/TB5490/.jpg"

Q68: Which of the following is not a

Q70: The form of nitrogen that comprises 78%

Q71: CAM plants<br>A)use energy sources at hydrothermal vents

Q72: The diagram below reminds us that NO<sub>x</sub>

Q87: An example of mutualism would be<br>A)a bird

Examlex

ExamLex

About UsContact UsPerks CenterHomeschoolingTest Prep

Work With Us

Campus RepresentativeInfluencers

Links

FaqPricingChrome Extension

Download The App

Get App StoreGet Google Play

Policies

Privacy PolicyTerms of ServiceHonor CodeCommunity Guidelines

Scan To Download

qr-code

Copyright © (2025) ExamLex LLC.

Privacy PolicyTerms Of ServiceHonor CodeCommunity Guidelines