Multiple Choice
The map below depicts the annual amount of 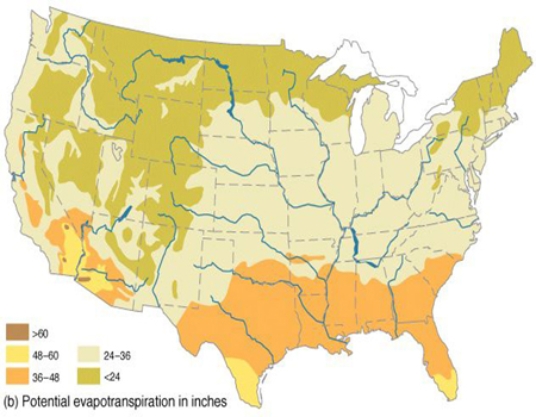
A) precipitation in inches.
B) potential evapotranspiration in inches.
C) humidity in percent.
D) runoff in cubic meters.
Correct Answer:

Verified
Correct Answer:
Verified
Related Questions
Q31: The residence time refers to the average
Q37: This map shows contours of the water
Q38: Which of these numbered features contains most
Q39: The water balance diagram below suggests that
Q40: Which of the following is NOT a
Q43: In which areas on the accompanying figure
Q44: Each number on this figure refers to
Q45: Which of the following is true about
Q46: Where on this cross section would groundwater
Q47: Which of the following controls the rate