Multiple Choice
The accompanying graph shows the number of Atlantic hurricanes since the 1880's.Based on when most global warming has occurred, one would conclude 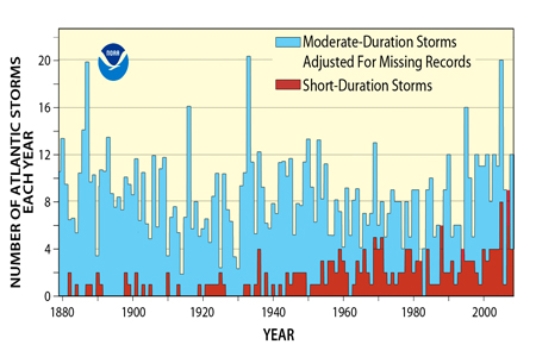
A) short duration hurricanes have increased in frequency.
B) all hurricanes have increased in frequency.
C) moderate duration hurricanes have increased in frequency.
D) no trends are apparent from this graph.
Correct Answer:

Verified
Correct Answer:
Verified
Q21: Though Khartoum and Urumqi both have dry
Q22: Mid-latitude climate generally<br>A)occur in the northern hemisphere,
Q23: Which of the following would NOT be
Q24: Solid aerosols<br>A)create secondary pollutants and destroy the
Q27: A factor that can influence earth's temperature
Q28: Which of the following best describes the
Q29: A major contributing factor to the lack
Q30: The Humid Subtropical climates (Cfa)<br>A)have a pronounced
Q31: Which of the following explains for the
Q48: Temperatures become more variable and precipitation decreases