Multiple Choice
 The figure above shows a nation's aggregate demand curve,aggregate supply curve,and potential GDP.
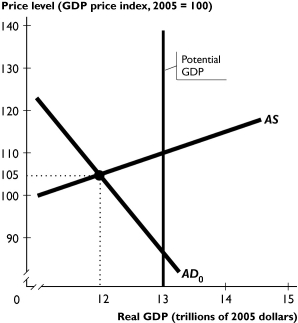
-In the figure above,the ________ gap is equal to ________.
A) recessionary;$1 trillion
B) inflationary;$1 trillion
C) recessionary;$12 trillion
D) inflationary;$12 trillion
E) recessionary;$13 trillion
Correct Answer:

Verified
Correct Answer:
Verified
Q58: Government expenditure _ change potential GDP and
Q59: In the United States,<br>A)Congress must approve monetary
Q60: Which of the following is NOT an
Q61: <img src="https://d2lvgg3v3hfg70.cloudfront.net/TB1457/.jpg" alt=" -Using the data
Q62: If a change in the tax laws
Q64: If tax revenue is $230 billion and
Q65: During the Great Depression,real GDP decreased,unemployment soared,and
Q66: If the Fed raises the federal funds
Q67: The Fed raises the federal funds rate.Which
Q68: <img src="https://d2lvgg3v3hfg70.cloudfront.net/TB1457/.jpg" alt=" The table above