Multiple Choice
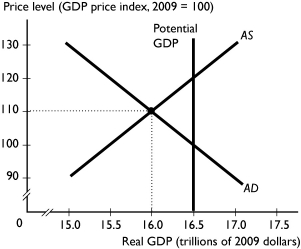
-In the figure above,the economy is at an equilibrium with real GDP of $16 trillion and a price level of 110.As the economy moves toward its ultimate equilibrium,the ________ curve shifts ________ because ________.
A) aggregate supply;leftward;the money wage rate rises
B) aggregate supply;rightward;the money wage rate falls
C) aggregate demand;rightward;the money wage rate falls
D) aggregate demand;leftward;the money wage rate rises
E) potential GDP;leftward;the money wage rate falls
Correct Answer:

Verified
Correct Answer:
Verified
Q303: A rise in the price level brings
Q304: The quantity of real GDP supplied decreases
Q305: <img src="https://d2lvgg3v3hfg70.cloudfront.net/TB1457/.jpg" alt=" The figure above
Q306: By itself,an increase in the price of
Q307: The main sources of cost-push inflation are
Q308: In the short run,a rise in the
Q309: When the price level falls,<br>A)the AS curve
Q310: A change in any of the following
Q311: What is the effect on aggregate supply
Q313: Moving along the aggregate supply curve,when the