Multiple Choice
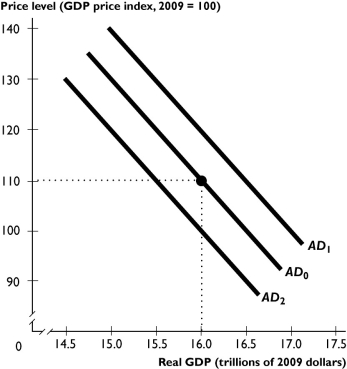 The figure above shows aggregate demand curves.
-Based on the figure above,the aggregate demand curve will shift from AD0 to AD1 when
A) potential GDP increases.
B) the price level falls.
C) the price level rises.
D) government expenditure decreases.
E) the Federal Reserve lowers the interest rate.
Correct Answer:

Verified
Correct Answer:
Verified
Q87: At the beginning of 2015,a country is
Q88: If the costs of production increase,there is<br>A)an
Q89: What two variables are determined in an
Q90: Demand-pull inflation starts with a shift of
Q91: In its macroeconomic equilibrium,the economy can be
Q93: If the price level increases from 110.0
Q94: A combination of declining real GDP and
Q95: When potential GDP increases,<br>A)the AS curve shifts
Q96: <img src="https://d2lvgg3v3hfg70.cloudfront.net/TB1457/.jpg" alt=" -What can lead
Q97: During 2010,a country reports that its price