Multiple Choice
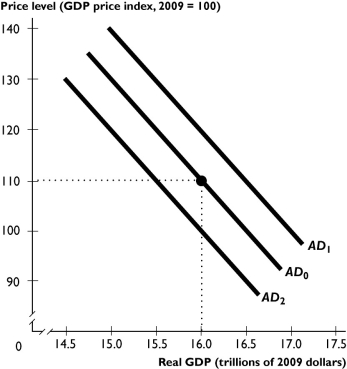 The figure above shows aggregate demand curves.
-Based on the figure above,the aggregate demand curve will shift from AD0 to AD2 when
A) potential GDP increases.
B) the price level falls.
C) taxes are lowered.
D) government expenditure increases.
E) the Federal Reserve raises the interest rate.
Correct Answer:

Verified
Correct Answer:
Verified
Q219: What are the two channels through which
Q220: How does a cut in interest rates
Q221: What factor changes the quantity of real
Q222: The aggregate supply curve slopes _ because
Q223: <img src="https://d2lvgg3v3hfg70.cloudfront.net/TB1457/.jpg" alt=" -The table above
Q225: Over the business cycle,factors such as the
Q226: Name the four factors of production that
Q227: If the money wage rate and the
Q228: A rise in the price level _
Q229: If oil prices increase,then in the short