Multiple Choice
 The figure above shows aggregate demand curves.
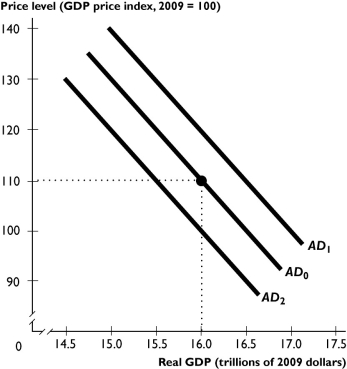
-Based on the figure above,the aggregate demand curve will shift from AD0 to AD2 when
A) potential GDP increases.
B) the price level falls.
C) the price level rises.
D) government expenditure decreases.
E) taxes are lowered.
Correct Answer:

Verified
Correct Answer:
Verified
Q162: Which of the following produces a movement
Q163: <img src="https://d2lvgg3v3hfg70.cloudfront.net/TB1457/.jpg" alt=" The figure above
Q164: Which of the following does NOT affect
Q165: Moving along the potential GDP line,the money
Q166: If potential GDP increases,<br>A)aggregate supply does not
Q168: The government passes a law which doubles
Q169: Last year the price level increased from
Q170: A change in the price level produces
Q171: How does a fall in the money
Q172: A deep recession hits the world economy,and