Multiple Choice
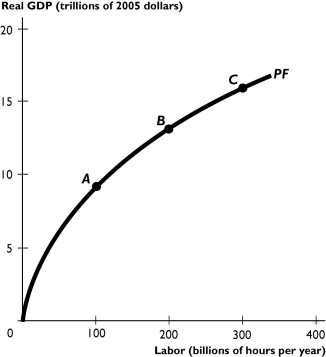
-The figure above shows the U.S.production function.How would an increase in income taxes be shown in the figure?
A) a movement from point C to point B
B) a movement from point A to point B
C) an upward shift or rotation of the production function
D) a downward shift or rotation of the production function
E) None of the above because the effects of an increase in taxes cannot be shown in the figure.
Correct Answer:

Verified
Correct Answer:
Verified
Q269: The Bubby Gum factory produces bubble gum.Joanne
Q270: <img src="https://d2lvgg3v3hfg70.cloudfront.net/TB1457/.jpg" alt=" -The figure above
Q271: Economic growth is defined as<br>A)a decrease in
Q272: One way to achieve faster growth in
Q273: Over the past 110 years,real GDP per
Q275: The widespread adoption of computers in the
Q276: Real GDP is $9 trillion in the
Q277: If the economy is fully employed,which of
Q278: Suppose that Australia has fully employed all
Q279: The labor force participation rate<br>A)increases as the