Multiple Choice
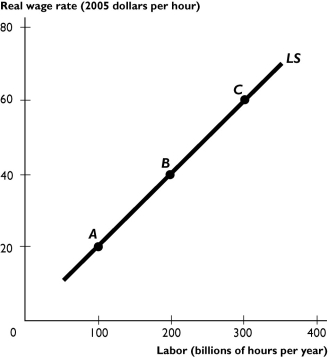
-The figure above shows the U.S.supply of labor curve.What was the affect of the decline in birth rates during the 1960s and 1970s on the supply of labor curve in the 1980s?
A) a rightward shift of the supply of labor curve
B) the supply of labor curve became steeper
C) a movement downward along the supply of labor curve from a point such as A to a point such as B
D) a leftward shift of the supply of labor curve
E) None of the above answers is correct because there was no change in the supply of labor curve.
Correct Answer:

Verified
Correct Answer:
Verified
Q261: Suppose that real GDP grows at 3
Q262: <img src="https://d2lvgg3v3hfg70.cloudfront.net/TB1457/.jpg" alt=" -The table above
Q263: The growth rate of real GDP per
Q264: During 2005,real GDP in Ireland grew 9.8
Q265: Which of the following policies encourages economic
Q267: If the government increases unemployment benefits,then the
Q268: Labor productivity is $20 per hour and
Q269: The Bubby Gum factory produces bubble gum.Joanne
Q270: <img src="https://d2lvgg3v3hfg70.cloudfront.net/TB1457/.jpg" alt=" -The figure above
Q271: Economic growth is defined as<br>A)a decrease in