Essay
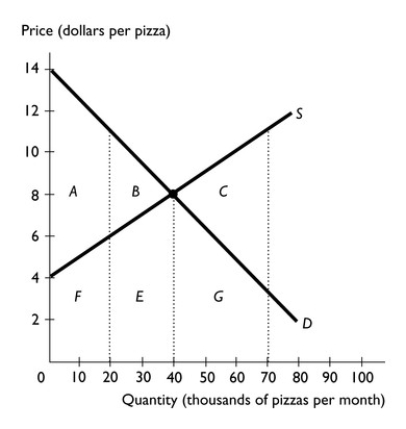
-The figure above shows the supply and demand for pizza.
a.What is the efficient level of output?
b.If 70,000 pizzas are produced,what area represents the deadweight loss?
c.Why does the deadweight loss in part (b)occur?
d.If 20,000 pizzas are produced,what area represents the deadweight loss?
e.Why does the deadweight loss in part (d)occur?
Correct Answer:

Verified
a.40,000 pizzas is the efficient quantit...View Answer
Unlock this answer now
Get Access to more Verified Answers free of charge
Correct Answer:
Verified
View Answer
Unlock this answer now
Get Access to more Verified Answers free of charge
Q1: A point on the demand curve shows
Q2: When output is less than the efficient
Q3: <img src="https://d2lvgg3v3hfg70.cloudfront.net/TB1458/.jpg" alt=" -The figure above
Q4: The fair results approach to fairness<br>A) requires
Q6: <img src="https://d2lvgg3v3hfg70.cloudfront.net/TB1458/.jpg" alt=" -The figure above
Q7: In the figure above,production efficiency occurs at
Q8: Hester owns an ice cream shop.It costs
Q9: The supply curve is upward sloping because
Q10: If the price is greater than the
Q11: <img src="https://d2lvgg3v3hfg70.cloudfront.net/TB1458/.jpg" alt=" -The figure above