Multiple Choice
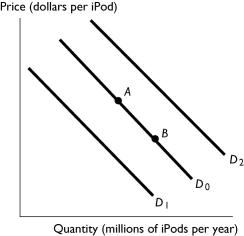
-The figure above shows the market for iPods.Which of the following shifts the demand curve from D0 to D2?
A) a decrease in the price of Zunes,a substitute for iPods
B) an increase in the price of iPods
C) a requirement that all students at universities have an iPod
D) a decrease in the price of iPods
E) a decrease in people's incomes if iPods are a normal good
Correct Answer:

Verified
Correct Answer:
Verified
Q5: An increase in the productivity of producing
Q75: A technological improvement lowers the cost of
Q87: When there is a shortage of parking
Q150: Which of the following lowers the equilibrium
Q187: If an early frost destroys most of
Q219: The demand for oranges increases while the
Q228: Peanut butter and jelly are complements for
Q230: For consumers,computers are a complement to computer
Q271: Market demand curves are obtained by<br>A) determining
Q311: Which of the following increases the quantity