Multiple Choice
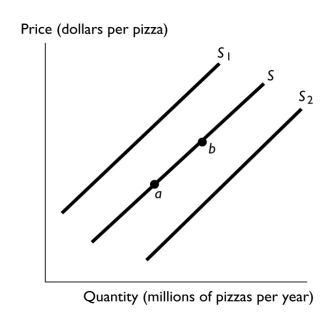
-In the above figure,the shift in the supply curve from S to S2 might reflect
A) a decrease in the cost of the tomato sauce used to produce pizza.
B) a decrease in the number of pizza producers.
C) an increase in the price of a pizza.
D) an increase in income if pizza is a normal good.
E) an increase in the price of a good that is a substitute for consumers.
Correct Answer:

Verified
Correct Answer:
Verified
Q28: If a higher price for wheat decreases
Q34: Which of the following definitely results in
Q100: The equilibrium price of a good occurs
Q144: <img src="https://d2lvgg3v3hfg70.cloudfront.net/TB1458/.jpg" alt=" -In the figure
Q157: Smart phones are becoming less expensive as
Q186: The "quantity demanded" of any good or
Q260: Which of the following increases the supply
Q265: <img src="https://d2lvgg3v3hfg70.cloudfront.net/TB1458/.jpg" alt=" -The above figure
Q309: In the above figure,_ will shift in
Q421: Soft drinks and milk are substitutes for