Multiple Choice
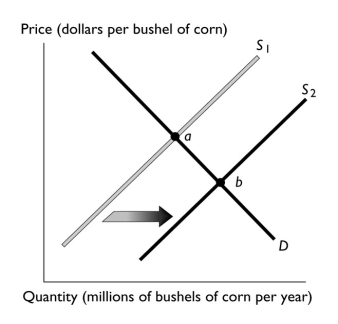
-The above figure illustrates the market for corn.If point "a" represents the original equilibrium and point "b" the new equilibrium,which of the following could have caused the change?
A) a decrease in the number of corn growers
B) a decrease the price of wheat,a substitute in production for corn
C) an increase in the cost of the seed used to grow the corn
D) a decrease in buyers' incomes if corn is an inferior good
E) an increased belief among buyers that corn is healthy
Correct Answer:

Verified
Correct Answer:
Verified
Q38: The law of supply reflects the fact
Q84: Consumers eat salsa with taco chips.The price
Q98: <img src="https://d2lvgg3v3hfg70.cloudfront.net/TB1458/.jpg" alt=" -The above figure
Q167: Suppose the equilibrium quantity of movie tickets
Q211: What leads to a decrease in the
Q250: <img src="https://d2lvgg3v3hfg70.cloudfront.net/TB1457/.jpg" alt=" -The figure above
Q273: Suppose that tattoos gained immense popularity with
Q275: Two brands of water,Natural Water and Mountain
Q283: If the number of companies producing memory
Q320: Candy makers accurately anticipate the increase in