Essay
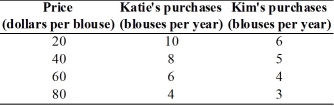
-The table above shows how many blouses Katie and Kim will purchase at different prices for a blouse.In the figure,label the axes and put the price on the y-axis and the quantity of blouses on the x-axis.Plot the data for Katie in the figure.Then,plot the data for Kim in the figure. 
Correct Answer:

Verified
 The figure above shows the la...
View Answer
Unlock this answer now
Get Access to more Verified Answers free of charge
Correct Answer:
Verified
View Answer
Unlock this answer now
Get Access to more Verified Answers free of charge
Q1: "The change in the value of the
Q21: <img src="https://d2lvgg3v3hfg70.cloudfront.net/TB1458/.jpg" alt=" -In the figure
Q74: Economists measure opportunity cost<br>A) only when it
Q105: Which of the following statements is a
Q126: Going skiing will cost Adam $80 a
Q172: Explain whether the statement, ʺHillary Clinton was
Q253: If the quantity of the variable on
Q259: In the diagram below,label the x-axis,the y-axis,and
Q290: When unskilled teens earn less than college
Q317: Demonstrating how an economic variable changes from