Multiple Choice
Figure 7-2 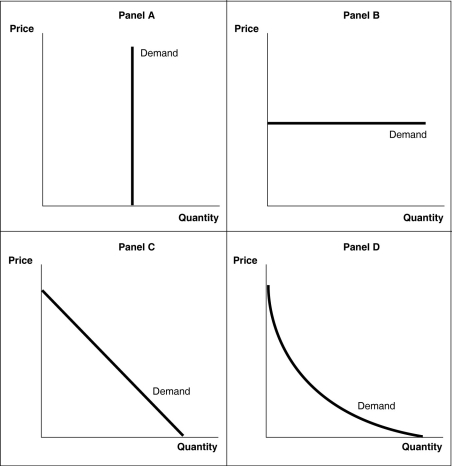
-Refer to Figure 7-2.The demand curve on which elasticity changes at every point is given in
A) Panel A.
B) Panel B.
C) Panel C.
D) none of the above graphs.
Correct Answer:

Verified
Correct Answer:
Verified
Related Questions
Q19: Suppose Joe is maximizing total utility within
Q56: For consumers who opt to pay a
Q118: By hiring Justin Bieber to advertise its
Q151: Table 7-3<br> <img src="https://d2lvgg3v3hfg70.cloudfront.net/TB4182/.jpg" alt="Table 7-3
Q161: Total utility<br>A)cannot decrease as a person consumes
Q166: What is the common feature displayed by
Q189: For each pair of items below determine
Q195: If a 35 percent increase in price
Q236: If a firm lowered the price of
Q291: Psychologists Daniel Kahneman and Amos Tversky conducted