Multiple Choice
Figure 15-4 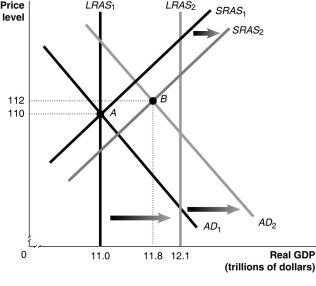
-Refer to Figure 15-4.In the figure above,LRAS1 and SRAS1 denote LRAS and SRAS in year 1,while LRAS2 and SRAS2 denote LRAS and SRAS in year 2.Given the economy is at point A in year 1,what is the growth rate in potential GDP in year 2?
A) 8%
B) 9.1%
C) 10%
D) 12%
Correct Answer:

Verified
Correct Answer:
Verified
Related Questions
Q6: Because of the slope of the aggregate
Q44: Suppose the economy is at full employment
Q102: Which of the following models relies on
Q136: German luxury car exports were hurt in
Q137: The long-run adjustment to a negative supply
Q168: If the U.S.dollar decreases in value relative
Q228: In September of 2007,the Federal Reserve Board
Q235: Which of the following is not an
Q239: When the price level in the United
Q268: After an unexpected _ in the price