Multiple Choice
The following figures represent distributions of gas molecules between two containers connected by an open tube. In which figure is the entropy of the system maximized?
A) 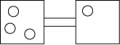
B) 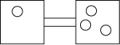
C) 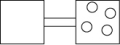
D) 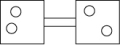
Correct Answer:

Verified
Correct Answer:
Verified
Related Questions
Q34: An oxygen molecule can have several different
Q69: The change in standard molar entropy, <font
Q70: Which of the following statements about equilibrium
Q72: Processes are always spontaneous when _ (H
Q73: Perfect crystals of carbon monoxide (CO) are
Q74: Which of the following states of motion
Q75: Which of the processes A-D will lead
Q76: Which of the following will have the
Q78: Which of the relationships A through D
Q79: Which of the following graphs best depicts