Essay
Given the following chart, calculate the cost function. Interpret the function to calculate variable costs and fixed costs: 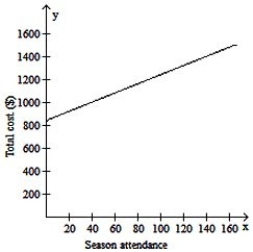
Correct Answer:

Verified
y-intercept = 840
Slope of the...View Answer
Unlock this answer now
Get Access to more Verified Answers free of charge
Correct Answer:
Verified
y-intercept = 840
Slope of the...
Slope of the...
View Answer
Unlock this answer now
Get Access to more Verified Answers free of charge
Related Questions
Q12: Victor plans to set up an online
Q13: Elaine's business budget included sales of $350
Q14: Raider Corporation made $130 000 in sales
Q15: Samsung sell refrigerators at $900 per unit.
Q16: Barb has a hot-dog stand near the
Q18: A company that makes environmental measuring devices
Q19: Caroline needs to put some money in
Q20: Excel hardware is introducing a new product
Q21: Last year, Terrific Copying had total revenue
Q22: Tarfex Tech intended to sell a new