menu-iconExamlexExamLexServices

Discover

Ask a Question
  1. All Topics
  2. Topic
    Business
  3. Study Set
    Principles of Cost Accounting
  4. Exam
    Exam 10: Cost Analysis for Management Decision Making
  5. Question
    Tennenholtz Company's Break-Even Graph Is Depicted Below
Solved

Tennenholtz Company's Break-Even Graph Is Depicted Below

Question 52

Question 52

Multiple Choice

Tennenholtz Company's break-even graph is depicted below.The line labeled "C" is:
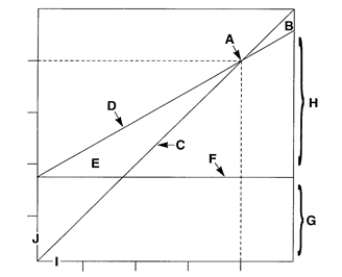
 Tennenholtz Company's break-even graph is depicted below.The line labeled  C  is:   ​ A) The sales line. B) The contribution margin line. C) The total cost line. D) The variable cost line. ​


A) The sales line.
B) The contribution margin line.
C) The total cost line.
D) The variable cost line.

Correct Answer:

verifed

Verified

Unlock this answer now
Get Access to more Verified Answers free of charge

Related Questions

Q47: If a company has an income tax

Q48: Sherpa Manufacturing has the following income statement

Q49: Consider the following information for the Dehning

Q50: Busby Company needs 10,000 units of a

Q51: The use of either absorption or variable

Q53: A manager can increase income under absorption

Q54: If the selling price and the variable

Q55: Which of the following would cause the

Q56: Consider the following information about the Gumm

Q57: The following data relate to a year's

Examlex

ExamLex

About UsContact UsPerks CenterHomeschoolingTest Prep

Work With Us

Campus RepresentativeInfluencers

Links

FaqPricingChrome Extension

Download The App

Get App StoreGet Google Play

Policies

Privacy PolicyTerms of ServiceHonor CodeCommunity Guidelines

Scan To Download

qr-code

Copyright © (2025) ExamLex LLC.

Privacy PolicyTerms Of ServiceHonor CodeCommunity Guidelines