Multiple Choice
Tennenholtz Company's break-even graph is depicted below.Which area indicates the break-even point? 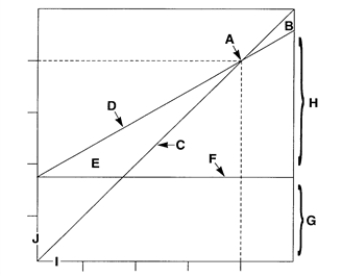
A) E.
B) G.
C) A.
D) H.
Correct Answer:

Verified
Correct Answer:
Verified
Related Questions
Q63: An example of a distribution cost that
Q64: The margin of safety is the amount:<br>A)by
Q65: Absorption cost is required for:<br>A)income tax purposes.<br>B)external
Q66: Mobile,Inc. ,manufactured 700 units of Product A,a
Q67: On a variable costing income statement,the difference
Q69: The Blue Saints Band is holding a
Q70: Net income reported under variable costing will
Q71: A basic tenet of variable costing is
Q72: The Tijama Manufacturing Company has determined the
Q73: Break-even sales volume in units is determined