Multiple Choice
Ten samples of n = 5 were collected to construct an  chart.The sample mean and range for each sample are shown in the table below.
 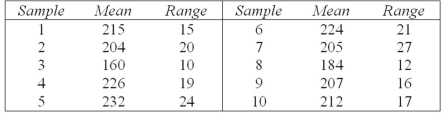 Calculate empirical lower and upper control limits for the R chart (you will need a table of control chart factors) .
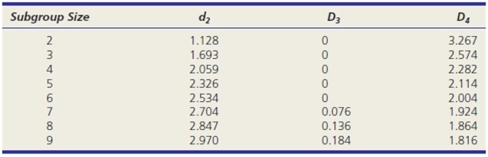
A) 0,45.86
B) 0,42.49
C) 0,38.26
D) 4.48,35.58
Correct Answer:

Verified
Correct Answer:
Verified
Q10: Which is a rule of thumb to
Q11: Ten samples of n = 5 were
Q12: If the specification subgroup size is n
Q22: Find the C<sub>pk</sub> index for a process
Q28: What does the fourth letter mean in
Q31: Which is not a true statement about
Q36: A c-chart is based on the Poisson
Q93: ISO 9000 specifies quality processes rather than
Q94: The C<sub>p</sub> index equals the C<sub>pk</sub> index
Q102: Statistical process control charts can measure:<br>A)the stability