Essay
Below are shown a dot plot and summary statistics for a random sample of 34 shower heads.The measurements are maximum flow rates (in gallons per minute)at pressure of 80 pounds per square inch.Use the data to illustrate the difference between the two alternative definitions of "outlier," and make any other comments you feel are relevant.Note: TrimMean removes the smallest 5 percent and the largest 5 percent of the values. 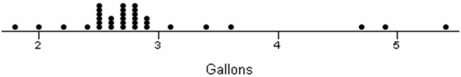

Correct Answer:

Verified
Upper inner fence is 3.5,upper outer fen...View Answer
Unlock this answer now
Get Access to more Verified Answers free of charge
Correct Answer:
Verified
View Answer
Unlock this answer now
Get Access to more Verified Answers free of charge
Q27: Which is not a measure of variability?<br>A)Mean
Q32: The 25<sup>th</sup> percentile for waiting time in
Q33: The values of x<sub>min</sub> and x<sub>max</sub> can
Q38: Three randomly chosen California students were asked
Q39: Exam scores in a small class were
Q45: The owner of a chicken farm kept
Q56: One benefit of the box plot is
Q118: Given the data set 10, 5, 2,
Q134: If the mean and median of a
Q137: For U.S. adult males, the mean height