Multiple Choice
The distribution pictured below is: 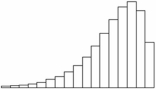
A) bimodal and skewed right.
B) bimodal and skewed left.
C) skewed right.
D) skewed left.
Correct Answer:

Verified
Correct Answer:
Verified
Related Questions
Q12: Excel's 3D pie charts are usually clearer
Q20: When using a dot plot with a
Q21: Which is not considered a deceptive graphical
Q22: Line charts are not used for cross-sectional
Q26: We would use a pivot table to:<br>A)cross-tabulate
Q31: A population is of size 5,500 observations.
Q71: Which is not a reason why pie
Q77: The _ can be used to differentiate
Q88: A histogram can be defined as:<br>A)a chart
Q98: The width of a class in a