Essay
Students were given a take-home statistics assignment and were asked to write down how long it took them (in minutes).Their answers are shown below.(a)Make a dot plot.(b)Use your judgment to construct a frequency distribution using whatever classes (bins)you wish.(c)Make a histogram.(d)Describe the distribution.(e)Did your bin choices agree with Sturges' Rule? If not,why not? 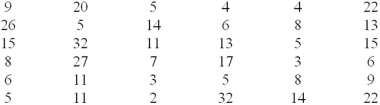
Correct Answer:

Verified
Dotplot suggests right-skewnes...View Answer
Unlock this answer now
Get Access to more Verified Answers free of charge
Correct Answer:
Verified
View Answer
Unlock this answer now
Get Access to more Verified Answers free of charge
Q25: Pie charts are attractive to statisticians, but
Q28: If you have 32 data points, how
Q51: Below is a sorted stem-and-leaf diagram for
Q52: Briefly list strengths and weaknesses of this
Q58: Below is a sorted stem-and-leaf diagram for
Q59: Briefly list strengths and weaknesses of this
Q60: Students were asked to record how many
Q72: Which is a characteristic of a histogram's
Q73: Which is not revealed on a scatter
Q89: A scatter plot is useful in visualizing