Essay
Ten part-time servers at a high-end restaurant were asked how many hours they worked last week,and how much they earned.The results are shown below.(a)Make a scatter plot.(b)Describe it.(c)What is your best guess of the average hourly pay? 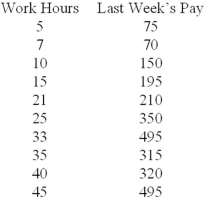
Correct Answer:

Verified
Positive relationshi...View Answer
Unlock this answer now
Get Access to more Verified Answers free of charge
Correct Answer:
Verified
View Answer
Unlock this answer now
Get Access to more Verified Answers free of charge
Q30: A frequency distribution usually has equal bin
Q39: Briefly list strengths and weaknesses of this
Q40: Sturges' Rule is merely a suggestion, not
Q42: A bar chart can sometimes be used
Q44: The distribution pictured below is: <img src="https://d2lvgg3v3hfg70.cloudfront.net/TB3508/.jpg"
Q50: To classify prices from 62 recent home
Q74: A common error with pie charts is
Q87: Which data would be suitable for a
Q99: Scatter plots are used to visualize association
Q104: Which is not a characteristic of an